powering-indias-digital-future-the-rise-of-data-centres.

From Data Analyst to Machine Learning Engineer in Nigeria

Are you a data analyst in Nigeria who wants to become a machine learning engineer? If so, you are already closer to that goal than you think. Not only do analysts already have core ML skills — Python, SQL, and statistics — but the gap between the two roles is smaller than most expect. In short, this is one of the most natural and well-paid career transitions in Nigerian tech right now.

Specifically, this guide maps the exact path from data analyst to ML engineer for Nigerian tech workers. Specifically, it covers the new skills to learn, the tools to master, a realistic timeline, and the salary jump you can expect. In addition, it shows the steps to take this week to get started. So, whether you work at a Lagos bank, an Abuja NGO, or a remote firm, this guide gives you a clear, honest roadmap to follow.


So, Why Should Nigerian Data Analysts Move Into Machine Learning?

Simply put, machine learning engineers earn greatly more than data analysts in Nigeria — and globally. While a strong data analyst in Nigeria earns N200,000 to N500,000 per month, a junior ML engineer typically earns N350,000 to N700,000. Senior ML engineers at top Nigerian firms or working remotely for global companies can earn $3,000 to $9,000 USD per month. Furthermore, the demand for ML engineers in Nigeria is growing fast while the supply of trained talent stays thin.

In addition, the move from data analyst to ML engineer does not mean starting over. Rather, it means building on skills you already have. Specifically, data analysts already know Python or R, understand data structures, can clean messy datasets, and think in terms of patterns and trends. Indeed, these are the exact foundations ML engineering sits on. So, the transition is more of a step up than a full career change. As a result, that makes it one of the smartest moves a Nigerian data pro can make right now.

The Nigerian Job Market Needs ML Engineers Urgently

Specifically, here are the key sectors in Nigeria actively hiring ML engineers right now — and paying a premium:

  • Also, fintech and banking: Fraud detection, credit scoring, and churn prediction models are now standard at Access Bank, Flutterwave, Paystack, and Kuda
  • Furthermore, telecoms: MTN, Airtel, and Glo use ML to predict network faults, reduce churn, and personalise customer offers
  • Additionally, e-commerce and retail: Jumia and other Nigerian platforms use tip and demand forecasting models
  • For instance, health tech: Startups like Helium Health and 54gene use ML for clinical data analysis and disease prediction
  • Moreover, government and NGOs: NITDA, CBN, World Bank, and UN agencies hire ML talent for data-heavy policy and programme work
  • Finally, remote global roles: Platforms like Andela, Turing, and Toptal place Nigerian ML engineers with US and European firms at dollar rates


What Data Analysts Already Have That ML Engineers Need

Before listing the new skills to learn, it helps to recognise what you already bring to the table. Specifically, most Nigerian data analysts with two or more years of experience already have a strong head start on the ML path. Here is what counts:

Skills That Transfer Directly

  • For example, Python or R: If you already use Python for data work, you know the main ML language. You just need to add new libraries on top.
  • Also, SQL: Every ML engineer queries databases to pull training data. Your SQL skills transfer directly and are used every single day
  • Furthermore, statistics: Your understanding of mean, variance, distributions, and correlation is the mathematical backbone of machine learning models
  • Additionally, data cleaning: ML models fail on dirty data. Your ability to clean, reshape, and validate datasets is one of the most underrated skills in the ML pipeline
  • Also, data visuals: Plotting data to find patterns is exactly how ML engineers explore features. Your Tableau or Power BI skills apply directly here.
  • Finally, business context: Understanding what a business actually needs from data is rare in pure ML engineers — your analyst background gives you an edge in turning models into real decisions


The New Skills You Need to Make the Transition

So, let us be specific about what you need to add. Specifically, the gap comes down to five key skill areas. Furthermore, each one is learnable in three to six months with focused daily study. So, here is exactly what to build:

1. Machine Learning Fundamentals

First, you need a solid grasp of core ML concepts and algorithms. Specifically, you should be able to explain and implement supervised learning models — linear regression, logistic regression, decision trees, and random forests. In addition, you need to understand unsupervised learning — clustering with K-Means and PCA with PCA. Furthermore, you need to know how to evaluate models using metrics like accuracy, precision, recall, F1 score, and ROC-AUC. Indeed, the best resource for this is Andrew Ng’s Machine Learning Specialization on Coursera — widely seen as the gold standard starting point.

2. Scikit-learn and the Python ML Stack

Next, as a data analyst you likely already use Pandas and NumPy. Now, however, you need to add Scikit-learn — the main Python library for building and testing ML models. Specifically, Scikit-learn lets you train models, tune parameters, build pipelines, and evaluate results in a consistent and clean way. In addition, you should also get comfortable with Matplotlib and Seaborn for model visuals. As a result, you will be able to go from raw data to a trained and evaluated model entirely in Python.

3. Deep Learning Basics

In addition, many ML roles now expect basic deep learning knowledge — the tech behind image recognition, text analysis, and recommendation systems. Specifically, you do not need to master deep learning to get your first ML role. However, you should understand how neural networks work and how to build a simple model in TensorFlow or PyTorch. You also need to know when to use deep learning versus classical ML. Furthermore, the DeepLearning.AI Specialization on Coursera — also by Andrew Ng — is the best structured path for this.

4. Model Deployment and MLOps Basics

Furthermore, one of the biggest gaps between data analysts and ML engineers is deployment. Specifically, data analysts produce reports and dashboards. Specifically, ML engineers build models that run inside live systems — apps, APIs, and automated pipelines. So, you need to learn how to wrap a trained model in a REST API using FastAPI or Flask. You also need to package it with Docker and push it to a cloud platform like AWS or Google Cloud. Not only does this skill set close the gap with senior ML engineers, but it also makes you far more hireable right away.

5. Version Control and Collaborative Coding

Also, data analysts often work alone in Excel or Jupyter notebooks. ML engineers work in teams using Git and GitHub to manage code, track changes, and review each other’s work. Specifically, you need to be comfortable with basic Git commands — clone, branch, commit, push, pull, and merge. In addition, a strong GitHub profile with real ML project code is now one of the first things ML employers check. Most look at it before they even read your CV. So, start building yours now.


A Realistic 6-Month Transition Timeline for Nigerian Analysts

So, how long does the transition actually take? Based on working Nigerian tech careers, here is a realistic month-by-month plan for a data analyst studying part-time at five to seven hours per week:

Month Focus Area Key Resources Milestone
Month 1 ML fundamentals + Scikit-learn Andrew Ng (Coursera), Kaggle Learn Train your first 3 ML models
Month 2 Model evaluation + feature engineering Scikit-learn docs, Kaggle notebooks Complete a full Kaggle mini-project
Month 3 Deep learning basics DeepLearning.AI (Coursera), fast.ai Build a neural net from scratch
Month 4 Model deployment + APIs FastAPI docs, AWS free tier, Docker Deploy a model as a live API
Month 5 MLOps basics + Git/GitHub MLflow docs, GitHub guides Push 2 projects to GitHub publicly
Month 6 Portfolio + job applications LinkedIn, Andela, Turing, Upwork Apply to 10+ ML roles per week


The Salary Jump: What to Expect After the Transition

Indeed, one of the strongest reasons to make this move is the pay difference. Specifically, here is what the salary progression looks like for Nigerian tech workers who make the switch from data analyst to ML engineer:

Role Nigeria (Local) Remote (USD/mo) Experience Level
Junior Data Analyst N150k–N280k/mo $800–$1,500 0–2 years
Senior Data Analyst N280k–N500k/mo $1,500–$3,000 2–5 years
Junior ML Engineer N350k–N700k/mo $2,500–$5,000 0–2 years (post-transition)
Mid-Level ML Engineer N600k–N1.2m/mo $5,000–$8,000 2–4 years
Senior ML Engineer N1m–N2m+/mo $7,000–$12,000 4+ years
MLOps / AI Lead N1.5m–N3m+/mo $10,000–$18,000 5+ years


How to Stand Out as a Nigerian ML Engineer in the Job Market

However, learning the skills is only half the job. Specifically, the Nigerian and global ML job market is tough. The candidates who get hired fastest are those who show their work clearly and build the right name for themselves. Here is how to stand out:

Build a Strong GitHub Portfolio

First, your GitHub profile is your live CV. Specifically, aim to have at least three to five well-documented ML projects on GitHub before you apply for your first ML role. Specifically, each project should have a clear README that explains the problem, the data, the model, and the results. Furthermore, pick projects tied to Nigerian business problems — fraud detection for fintech, crop yield for agri-tech, or disease risk for health NGOs. As a result, your work will stand out from the hundreds of generic tutorial projects that most candidates submit.

Compete on Kaggle

Next, Kaggle competitions are one of the fastest ways to prove ML skills to employers without a formal ML job title yet. Specifically, entering even beginner Kaggle competitions gives you real practice on messy data. It also forces you to compare your models against others and builds a public track record of your ML work. In addition, a top-20% finish on any Kaggle competition is a credible signal that Nigerian and global employers recognise. So, join your first Kaggle competition this week — even if you do not finish in the top ranks, the practice alone is worth it.

Get the Right Certificates

In addition, the right certs signal to employers that you have covered the core curriculum in a structured way. Specifically, three certs carry the most weight: the ML Specialization by Andrew Ng on Coursera, the DeepLearning.AI TensorFlow Developer cert, and the AWS Certified Machine Learning Specialty. Furthermore, these three together show breadth across ML theory, deep learning, and cloud deployment — which is exactly what most ML job specs ask for.

Join the Nigerian Data and ML Community

Also, your network matters as much as your skills in the Nigerian tech job market. Specifically, join Data Science Nigeria, the Lagos Data Science Meetup, and the Abuja Tech Hub. All of these run events, mentorship cycles, and job referral channels. Furthermore, posting about your ML journey on LinkedIn builds visibility with Nigerian tech recruiters. They actively scout the platform for emerging talent. As a result, community involvement often leads to job opportunities faster than cold applications alone.


Frequently Asked Questions (FAQs)

Q1: So, How Long Does the Transition Take From Data Analyst to ML Engineer in Nigeria?

Generally, for most Nigerian data analysts, the full transition takes six to twelve months of consistent part-time study. Specifically, analysts with strong Python and statistics backgrounds tend to move faster — often in six months. Those who need to build Python skills from scratch may take nine to twelve months. In addition, the timeline shortens greatly if you follow a structured path. A programme like Abuja Data School or Andrew Ng’s Coursera Specialization is far more effective than learning randomly from YouTube alone.

Q2: Furthermore, Do I Need a New Degree to Become an ML Engineer in Nigeria?

No, you do not need one. Specifically, most ML engineering roles in Nigerian tech firms and global remote companies do not require a new degree. What they want is a strong portfolio of ML projects, relevant certs, and the ability to pass a technical interview. In addition, platforms like Andela, Turing, and Toptal assess Nigerian candidates purely on skills and project quality — not on academic qualifications. So, invest your time in learning and building, not in applying for a new degree programme.

Q3: Also, Is Python Enough or Do I Need to Learn Other Languages?

Indeed, Python is enough for the vast majority of ML roles in Nigeria and globally. Specifically, Python plus Scikit-learn, TensorFlow or PyTorch, and FastAPI for deployment covers over 90% of what ML engineer job specs require. In addition, SQL remains essential for data access and prep work. So, if you already know Python and SQL, you have the two most important languages you need. The rest is just libraries and frameworks built on top of Python.

Q4: Additionally, Can I Transition While Working Full-Time as a Data Analyst in Nigeria?

Yes — and indeed many Nigerian data analysts do exactly this. Specifically, one hour each weekday plus three to four hours on weekends adds up to eight to ten hours per week. At that pace, the six-month transition timeline is very realistic. Furthermore, your current data analyst job actually helps the transition because you can apply new ML concepts to your existing work data in practice. As a result, you learn faster and build relevant local portfolio projects at the same time.

Q5: Finally, What Is the Best First ML Project for a Nigerian Data Analyst to Build?

The best first project is one that uses data you already understand from your current work. Specifically, if you work in finance, build a loan default prediction model. If you work in telecoms, build a customer churn model. If you work in health, build a patient readmission risk model. These are real problems Nigerian employers know well. A working model built on local data shows far more than any generic tutorial project. In addition, publish it on GitHub with a clear write-up and share it on LinkedIn to start building your ML public profile today.


Conclusion

Ultimately, the path from data analyst to ML engineer is one of the clearest and most rewarding moves for Nigerian tech workers in 2025. Not only do you already have the foundation — Python, SQL, and stats — but the new skills are all learnable in six focused months. In addition, the salary jump is real and the demand is strong. The global remote market gives Abuja and Lagos-based ML engineers access to dollar income without leaving Nigeria.

Your Move Starts Today

To that end, do not wait until you feel fully ready — start with one course this week. Specifically, enrol in Andrew Ng’s Machine Learning Specialization on Coursera, create a free Kaggle account, and push your first ML notebook to GitHub. Above all, every senior ML engineer in Nigeria started exactly where you are right now. As a result, your first ML job offer, your first remote contract, and your first dollar pay cheque are all just six consistent months away. Start today.

https://www.abujadataschool.com/artificial-intelligence-and-robotics-training-in-abuja-nigeria/

ai-bp-2

How Abuja Civil Servants Can Use AI to Work Smarter

Are you a federal civil servant in Abuja looking for ways to work smarter in 2026? If so, AI tools are about to change how you write memos, analyze data, plan projects, and serve the public. Not only are these tools free or very low cost, but most of them need no coding skills or tech background to use. In short, any civil servant with a laptop and internet access can start using AI at work today.

Specifically, this guide covers the most practical AI tools and methods for federal civil servants in Abuja. It shows you how to use AI to write faster, cut research time, summarise long reports, manage data, and communicate more clearly. Furthermore, it addresses key concerns around data safety and government policy. It also shows how to use AI in a way that is smart and responsible. So, read on and discover how AI can help you do your best work in 2026.


So, Why Should Federal Civil Servants in Abuja Embrace AI in 2026?

Simply put, the nature of civil service work is changing fast. In 2026, federal ministries in Abuja face growing demands. There are more policy briefs to write, more data to analyze, more reports to submit, and more citizens to serve. Yet staff numbers and budgets rarely grow at the same pace. As a result, civil servants who learn to use AI tools well can do the work of two people in half the time.

Indeed, the Nigerian federal government has already signalled its support for AI in public service. NITDA’s digital strategy and the National AI Policy both push for AI adoption across ministries. In addition, agencies like the CBN, NBS, and FIRS are already piloting AI tools for data work and citizen services. So, getting ahead of this shift now pays off. You will be among the most valued staff in your ministry as digital reform picks up pace.

The Real Benefits AI Brings to Civil Service Work

Here are the key gains AI tools bring to day-to-day civil service work in Abuja:

  • Write faster: AI can draft a memo or report in minutes — giving you a strong first draft to edit, not a blank page to fill
  • Research quicker: AI tools can scan large documents and summarise key points in seconds — cutting hours of reading to just minutes
  • Reduce errors: AI grammar and clarity tools catch mistakes before your work reaches your director or minister
  • Handle data better: AI-powered spreadsheet tools can analyse data, spot trends, and build charts without needing a data analyst
  • Communicate more clearly: AI helps you write plain, direct language that citizens and colleagues can understand without confusion
  • Free up time: By automating routine tasks, AI gives you back time to focus on the high-value work that truly needs your judgement


How Civil Servants Can Use AI for Writing and Document Work

Writing is at the heart of civil service work. Every day, civil servants in Abuja write memos, policy briefs, cabinet papers, letters, reports, and meeting minutes. AI tools can make all of this faster, clearer, and more polished. Specifically, here is how to use AI for each type of document:

Writing Memos and Policy Briefs

First, AI tools like ChatGPT and Copilot can draft a full memo from a short set of bullet points you provide. The result is a clean, structured draft in seconds. Specifically, you type the key facts, the purpose, and the action needed — and the AI writes a clean, structured draft in seconds. Furthermore, you can ask the AI to adjust the tone — making it more formal for a minister or clearer for a field officer. As a result, what used to take two hours now takes twenty minutes.

However, always review and edit AI-generated text before you send it. Specifically, check that all facts are correct, that the names and dates are right, and that the language matches your ministry’s house style. In addition, never put classified or sensitive information into a public AI tool. Use only unclassified content when working with free AI services like ChatGPT or Gemini.

Summarising Long Reports and Documents

Next, civil servants often receive long reports, audit findings, and research papers that need to be read and acted on quickly. AI tools are outstanding at this task. Specifically, paste the text of a long document into ChatGPT or Claude. Then ask it for a one-page summary, the key findings, or a list of action points. As a result, a 60-page report can be turned into a clear, useful brief in under five minutes.

In addition, Copilot — built into Word, Outlook, and Teams — can summarise documents and email threads directly inside the tools you already use. So, if your ministry uses Microsoft 365, Copilot may already be available to you at no extra cost. Check with your ICT department to see if your licence includes it.

Drafting Letters and Public Communications

Also, AI tools can help civil servants write clear, professional letters to members of the public, to contractors, or to other ministries. Specifically, you give the AI the key message and the recipient type, and it produces a polished draft that follows standard letter format. Furthermore, AI grammar tools like Grammarly — free version available — can check the final text for errors before you send it. As a result, public-facing letters from your ministry will be cleaner and more professional with far less effort.


Using AI to Handle Data and Reporting in Your Ministry

Many civil servants deal with data every week — budget figures, survey results, project tracking sheets, and performance records. Not only can AI tools help you make sense of data faster, but they can also build charts and spot trends. No specialist data training is needed to use them.

AI Tools for Spreadsheet Work

Specifically, Microsoft Excel now has Copilot — an AI feature that writes formulas, summarises data, and builds pivot tables from plain English instructions. For example, you can type: ‘Show me total spend by ministry for Q1’ and Excel will build the table for you. In addition, Google Sheets has a similar AI feature called Help Me Analyse that works in the same way. As a result, civil servants who used to struggle with VLOOKUP and pivot tables can now get the same results just by asking.

Using Power BI for Ministry Dashboards

Furthermore, Power BI is one of the most powerful ways for Abuja ministries to track and display key data. The basic version is completely free. Specifically, it connects to Excel files and builds live charts and dashboards that update when your data changes. Not only is the basic version free, but it also runs well on a standard government laptop. In addition, the NITDA digital skills programme includes Power BI training for civil servants across Nigeria. So, ask your ministry’s ICT unit about access and training.

AI for Budget and Financial Tracking

In addition, civil servants who manage budgets can use AI to track spending, flag overspend, and model different budget scenarios. Specifically, ChatGPT can help you write budget narratives and draft variance reports. It can also explain complex financial data in plain language for non-finance colleagues. Furthermore, Google Gemini integrates with Google Sheets and can generate budget summaries and trend analysis directly inside your spreadsheet. As a result, your end-of-quarter reports can be produced in a fraction of the usual time.


Top Free AI Tools Every Federal Civil Servant in Abuja Should Know

Here is a guide to the best free AI tools for civil servants in Abuja — what each does and how to access it:

AI Tool Best Used For Cost How to Access
ChatGPT (OpenAI) Writing, research, summaries, drafts Free (GPT-4o) chat.openai.com
Microsoft Copilot Word, Excel, Outlook, Teams tasks Free with Microsoft 365 copilot.microsoft.com
Google Gemini Research, writing, Google Sheets Free gemini.google.com
Claude (Anthropic) Long docs, analysis, clear writing Free tier available claude.ai
Grammarly Grammar, clarity, tone checking Free basic version grammarly.com
NotebookLM (Google) Summarise and query PDF documents Free notebooklm.google.com
Power BI Desktop Data dashboards and charts Fully free powerbi.microsoft.com
Otter.ai Meeting transcription and summaries Free basic plan otter.ai


How to Use AI to Run Better Meetings and Manage Projects

Meetings are a major part of civil service life in Abuja — and they eat up a lot of time. AI tools can make meetings shorter, more focused, and easier to follow up on. So, here is how to use AI at each stage of your meeting cycle:

Before the Meeting: Use AI to Prepare Agendas

First, you can use ChatGPT or Copilot to draft a clear, structured agenda from a brief description of the meeting’s purpose. Specifically, type the topic, the attendees, and the key points to cover — and the AI will produce a formal agenda in seconds. Furthermore, AI can also help you prepare background notes and briefing papers for your director before key meetings, cutting your prep time in half.

During the Meeting: Use AI for Live Transcription

Next, tools like Otter.ai and Microsoft Teams’ live transcript feature can record and transcribe your meeting in real time. Specifically, the transcript captures every word spoken — so you do not have to write notes by hand. As a result, you can focus on the discussion rather than on scribbling minutes. Moreover, Otter.ai can also produce a summary of the meeting with action points automatically after the session ends.

After the Meeting: Use AI to Write Minutes

In addition, once you have a transcript, paste it into ChatGPT. Ask it to produce formal minutes in the standard civil service format. Specifically, it will pull out the decisions made, the actions agreed, and the persons responsible — all formatted as a proper minutes document. As a result, a task that used to take an hour or more after every meeting now takes under ten minutes.


Using AI Responsibly as a Federal Civil Servant

With great tools come real responsibilities. Specifically, civil servants must use AI within the rules of public service. This means protecting sensitive data, being honest about AI use, and checking all output before it goes out. Here are the key rules to follow:

Never Input Classified or Sensitive Data

First and foremost, never put classified, confidential, or personal citizen data into a public AI tool like ChatGPT or Gemini. Specifically, these tools store and may use inputs for model training — which means sensitive government information could be exposed. Instead, use AI only with unclassified, public, or general information. Furthermore, your ministry’s ICT policy will have specific rules on approved AI tools — always check and follow these before you start.

Always Review AI Output Before Use

Next, AI tools can and do make mistakes. Specifically, they can produce facts that sound correct but are wrong — a problem known as hallucination. Therefore, always verify key facts, figures, and names in any AI-generated document before you sign off on it. In addition, the final responsibility for all official output remains with the civil servant, not the AI tool. So, use AI as a first draft helper — not as a replacement for your own judgement.

Be Transparent About AI Use

Also, be open with your team and your director about using AI tools at work. Specifically, AI is a productivity tool — just like a calculator or a search engine. There is nothing to hide about using it at work. Furthermore, being open about your AI use helps your team learn. It also builds a culture of smart, responsible digital work across your ministry. In addition, the Nigerian AI Policy supports transparent AI use in public service. So you are on the right side of policy when you are open about it at work.

Protect Citizen Privacy

In addition, if your work involves citizen data — tax records, benefits, or health records — never use public AI tools to process it. Specifically, all citizen data must stay within approved, secure government systems. If your ministry needs AI tools to process citizen data, that requires a formal procurement process through your ICT unit and NITDA’s guidance. So, keep public AI tools strictly for internal productivity tasks that do not touch citizen records.


A Practical 5-Step Plan for Civil Servants to Start Using AI in Abuja

Getting started with AI does not have to be complex. Specifically, you can go from zero to productive with AI tools in your first week. Here is a simple five-step plan:

Step 1: Start With One Tool

First, do not try to learn five AI tools at once. Instead, pick one — ChatGPT is the best starting point. It is free, easy to use, and handles writing, research, and summaries very well. Specifically, create a free account at chat.openai.com and spend 30 minutes exploring it on your first day. Ask it to write a short memo on any topic you know well. This way, you will see how it works before using it on real work.

Step 2: Use It on a Low-Risk Task First

Next, try AI on an internal, non-sensitive task before using it on anything important. Specifically, ask it to draft a training notice, summarise a published government report, or write a welcome message for a ministry event. As a result, you will build confidence with the tool on a safe task before trusting it with more important work.

Step 3: Learn Prompt Writing Basics

In addition, the quality of what AI gives you depends on the quality of what you ask it. Specifically, a good prompt is clear, gives context, and states the format you want. For example: ‘Write a one-page policy brief for the Minister of Finance on the impact of fuel subsidy removal on federal civil servants in Abuja. Use formal English and bullet points for key recommendations.’ This way, you get a focused, useful output rather than a vague general response.

Step 4: Share What You Learn With Your Team

Furthermore, once you find an AI approach that works well, share it with your colleagues. Specifically, run a short 30-minute show-and-tell session in your department to show two or three ways you have used AI to save time. Not only does this help your team work smarter, but it also builds your reputation as a forward-thinking civil servant who drives change. As a result, AI adoption spreads fastest from the ground up — from officers who use it, not just from top-down policy.

Step 5: Keep Learning as the Tools Improve

Finally, AI tools are improving every month. So, set aside 30 minutes each week to try a new AI feature or tool. Specifically, follow NITDA’s digital updates and Google’s AI newsletter. Check Microsoft’s Copilot release notes for new features that apply to your ministry work. As a result, you will stay ahead of your peers. You will also be ready to lead AI adoption in your ministry as the federal government’s digital reform rolls out in 2026 and beyond.


Frequently Asked Questions (FAQs)

Q1: So, Is It Official Policy for Civil Servants to Use AI in Nigeria?

Yes. Specifically, Nigeria’s National AI Policy and NITDA’s digital strategy both support AI tools in public service. The goal is to improve efficiency and service delivery. In addition, the 3MTT programme actively trains civil servants and government workers in AI and digital skills. However, individual ministries may have their own ICT policies on which tools are approved. So, always check your ministry’s guidelines before using any new AI tool on official work.

Q2: Furthermore, What If I Have No Tech Background — Can I Still Use AI?

Yes, absolutely. In fact, the best AI tools are designed for non-tech users. Specifically, ChatGPT, Gemini, and Copilot all work in plain English — you type what you want, and the AI responds in plain text. No coding, no installation, and no special training are needed to get started. In addition, Microsoft has built AI features directly into Word, Excel, and Outlook. Most civil servants already use these tools every day — so the learning curve is very gentle.

Q3: Also, Will AI Take Civil Servants’ Jobs?

Not in the short term — and not if you use it well. Specifically, AI tools handle routine, repetitive tasks. This frees civil servants to focus on higher-value work that needs human judgement and accountability. In addition, the Nigerian public service is vast and complex. AI will not replace the trust, relationships, and experience that experienced civil servants bring. Rather, civil servants who use AI well will be more productive and more valued than those who do not.

Q4: Additionally, Which AI Tool Is Best for Writing Government Reports?

For most report writing tasks, ChatGPT and Microsoft Copilot are the best starting points. Specifically, ChatGPT is great for drafting from scratch based on bullet points you provide. Copilot is better if you work in Microsoft Word and want AI suggestions directly inside your document. In addition, Claude at claude.ai handles long, complex documents very well. It produces clear, structured text that suits formal government writing styles.

Q5: Finally, How Can I Get AI Training as a Civil Servant in Abuja?

There are several free options open to you right now. Specifically, the NITDA 3MTT programme offers free AI and digital skills training for Nigerian public servants — visit 3mtt.nitda.gov.ng to check your eligibility. In addition, Google’s free AI path on Cloud Skills Boost covers practical office AI tools. Microsoft Learn offers free AI training that covers the same ground for Microsoft users. Furthermore, Abuja Data School offers in-person and online AI training tailored to Nigerian government and business contexts.


Conclusion

Ultimately, 2026 is the year for federal civil servants in Abuja to embrace AI — not with fear, but with purpose. Whether you start with ChatGPT to draft a memo, or try Power BI to track your budget data, each small step builds your skills. Each step also builds your value at work. In addition, the tools are free, the learning curve is gentle, and the gains in speed and quality are real from day one.

Start This Week — Not Next Quarter

To that end, pick one AI tool from the table in this guide and use it on one real work task this week. Above all, do not wait for a formal training programme or a top-down directive — the best time to start is now. As a result, you will be better prepared, more productive, and more confident. AI is fast becoming a standard part of federal civil service work in Abuja and across Nigeria.

https://www.abujadataschool.com/artificial-intelligence-and-robotics-training-in-abuja-nigeria/

Artificial-Intelligence-Training-Machine-Learning-Course-in-Abuja

Machine Learning Training in Abuja: Your Complete Guide

machine-learning

Are you looking for machine learning training in Abuja? If so, you are making one of the smartest career moves of 2025. Not only is machine learning the engine behind AI tools and fraud systems across Nigeria, but Abuja is also fast becoming the top city for ML training in West Africa. In short, the right machine learning course in Abuja can lead to high-paying local roles, remote jobs, and freelance income that grows year on year.

Specifically, this guide covers the best machine learning training options in Abuja — from short bootcamps to full degree paths. It also breaks down the key skills you will learn, the top schools to consider, how much training costs, and what careers follow. So, whether you are a fresh graduate, a working analyst, or a career changer, this guide is for you. It will help you find the right ML training path for your goals.


So, Why Is Machine Learning Training in Abuja So Valuable Right Now?

Simply put, machine learning is the skill that makes AI work. Every smart system — from fraud alerts at Nigerian banks to recommendation engines on Nigerian e-commerce sites — runs on ML models built by trained engineers. Furthermore, the Nigerian government’s digital agenda has put ML at the top of the priority list. The rise of fintech, health tech, and agri-tech startups has also made ML talent very scarce and highly sought after.

Indeed, Abuja sits at the heart of this demand. The city is home to the Central Bank of Nigeria, NITDA, the NBS, major telecoms firms, and dozens of global bodies. All of these groups now use ML in some form. As a result, an ML-trained expert in Abuja has access to some of the best-paid data roles in Nigeria. They also have the widest range of employers to choose from. Therefore, getting machine learning training in Abuja today puts you ahead of the curve.

Industries in Abuja Actively Using Machine Learning

Here are the key sectors in Abuja that are hiring ML talent right now:

  • Banking and finance: Fraud detection, credit scoring, customer churn prediction, and loan approval models
  • Government and public sector: CBN, NITDA, and NBS use ML for policy data analysis and economic forecasting
  • Telecoms: MTN, Airtel, and Glo apply ML to cut churn, improve networks, and target ads more precisely
  • Healthcare and NGOs: Disease surveillance, patient risk scoring, and drug supply forecasting all use ML models
  • Oil and gas: NNPC and upstream firms use ML for equipment failure prediction and reservoir data analysis
  • International bodies: World Bank, UN agencies, and USAID use ML for programme monitoring and impact assessment


What Will You Learn in Machine Learning Training in Abuja?

Before picking a course, it helps to understand what machine learning training actually covers. Not all ML courses teach the same things. So, here is what a strong machine learning programme in Abuja should include:

Core Machine Learning Skills

First, every solid ML course covers these essential skills:

  • Python for ML: The main coding language for machine learning — covers NumPy, Pandas, and Scikit-learn
  • Supervised learning: Teaching a model using labelled data — includes regression, classification, and decision trees
  • Unsupervised learning: Finding patterns in data without labels — covers clustering, dimensionality reduction, and anomaly detection
  • Model evaluation: How to test if your ML model is accurate — covers metrics like accuracy, precision, recall, and F1 score
  • Feature engineering: How to prepare raw data so ML models can learn from it more effectively
  • Model deployment: How to take a trained ML model and make it live in a real app or business system

Advanced ML Skills

In addition, the best ML programmes in Abuja also cover more advanced topics that open up senior roles:

  • Deep learning: Neural networks for image recognition, speech, and natural language tasks — uses TensorFlow and PyTorch
  • Natural language processing (NLP): Teaching machines to read and understand text — used in chatbots, sentiment analysis, and document review
  • Computer vision: How machines interpret images and video — used in security systems, medical imaging, and retail analytics
  • MLOps: How to manage, monitor, and update ML models in production — a key skill for senior ML roles
  • Cloud ML platforms: Using AWS SageMaker, Google Vertex AI, or Azure ML to train and deploy models at scale
  • Time series forecasting: Predicting future values from historical data — widely used in finance, supply chain, and energy sectors in Nigeria


Top Machine Learning Training Schools and Courses in Abuja

Now let us look at the specific schools and courses offering machine learning training in Abuja. Indeed, the options cover every budget and learning style — from in-person bootcamps to free online paths.

1. Abuja Data School

First and foremost, Abuja Data School is the leading hands-on ML training centre in the FCT. Their machine learning programme covers Python, Scikit-learn, deep learning, NLP, and model deployment — all using real Nigerian datasets and business problems. Specifically, the course is designed for the Nigerian job market and includes career support, portfolio guidance, and mentorship after graduation. Furthermore, the school runs both in-person classes at their Abuja campus and live online sessions for students outside the FCT.

  • Duration: 3 to 6 months
  • Mode: In-person (Abuja) and live online
  • Key skills: Python, Scikit-learn, TensorFlow, NLP, model deployment, MLOps basics
  • Standout: Nigerian datasets, career placement support, and real project work throughout


2. NITDA 3MTT — Machine Learning Track

In addition, the NITDA 3 Million Technical Talent (3MTT) programme includes a machine learning track for eligible Nigerians. Specifically, this track covers Python basics, ML basics, and practical AI tools. Because it is a government-funded programme, the cost is very low or free for those who qualify. As a result, it is one of the most open ML training paths in Abuja for learners who cannot afford private school fees right now.

  • Duration: 3 to 6 months
  • Cost: Free or heavily subsidised
  • Key skills: Python, ML basics, data analysis, AI tools for work
  • How to apply: Visit 3mtt.nitda.gov.ng and check your eligibility


3. Coursera — Machine Learning Specialisation (Andrew Ng)

Furthermore, the Machine Learning Specialisation by Andrew Ng on Coursera is the most respected ML course in the world. Specifically, it covers supervised learning, unsupervised learning, deep learning, and best practices — all in a structured three-course path. In the same vein, the DeepLearning.AI courses on Coursera pair well with this to cover neural networks and deep learning in depth. Moreover, Nigerian learners can audit these courses free or pay $49 per month for a certificate.

  • Duration: 3 to 4 months at 5 hours per week
  • Cost: Free to audit or $49/month for a certificate
  • Key skills: Supervised and unsupervised learning, neural networks, ML best practices
  • Best for: Self-paced learners who want a globally respected ML certificate


4. Google Machine Learning Crash Course (Free)

Also, Google offers a free Machine Learning Crash Course that covers ML basics, TensorFlow, and practical model building. Specifically, it is designed for beginners and uses clear examples that are easy to follow even without a strong math background. In addition, Google Cloud Skills Boost offers a free ML learning path that covers cloud-based ML tools used by many Abuja employers. So, this is a great free starting point before investing in a paid course.

  • Duration: 15 hours at your own pace
  • Cost: Fully free
  • Key skills: ML basics, TensorFlow, model training, Google Cloud AI
  • Best for: Complete beginners who want a free, structured entry into machine learning


5. University of Abuja and NOUN — ML Modules

Finally, both the University of Abuja and NOUN offer ML modules. These appear in their computer science and data science programmes. Specifically, NOUN’s distance learning model means you can study ML theory and applied data science from anywhere in Nigeria at very low cost. Furthermore, a formal degree adds academic weight to your CV alongside your practical ML certificates and project portfolio.

  • Duration: 1 to 4 years depending on the programme level
  • Cost: N50,000 to N200,000 per year depending on the institution
  • Key skills: ML theory, algorithms, statistics, programming, research methods
  • Best for: Learners who want formal academic credentials alongside practical ML skills


Machine Learning Training Costs in Abuja: Full Comparison

Cost is often the first thing learners want to know. So, here is a clear side-by-side comparison of the main ML training options in Abuja:

Training Option Duration Cost Best For
Abuja Data School 3–6 months N150k–N350k Hands-on, job-ready ML training
NITDA 3MTT 3–6 months Free–subsidised Budget learners, beginners
Coursera (Andrew Ng) 3–4 months $49/mo or free Global cert, self-paced study
Google ML Crash Course 15 hours Free Beginners, quick ML overview
University of Abuja 2–4 years N80k–N200k/yr Formal academic credentials
NOUN Distance Learning 1–4 years N50k–N120k/yr Flexible, low-cost degree path


Machine Learning Career Paths After Training in Abuja

Once you complete your ML training, the career options are wide — both locally and in the global remote job market. Here are the main roles and what they pay in Nigeria and globally:

Machine Learning Engineer

To start, the ML engineer role is the core job that ML training leads to. Specifically, ML engineers build, train, and deploy machine learning models for real business use. They work with Python, Scikit-learn, TensorFlow, and cloud platforms to create systems that predict outcomes and automate decisions. In Abuja, ML engineers earn N300,000 to N700,000 per month. Remote roles at global tech firms pay $3,000 to $9,000 USD per month.

Data Scientist

Next, data scientists use ML as part of a broader role that includes data analysis, visualisation, and business insight. Specifically, this is the most common senior data role in Nigerian banks, telecoms, and NGOs. In addition, data scientists with strong ML skills are in very high demand at the World Bank, UN bodies, and USAID offices in Abuja. Pay for this role ranges from N350,000 to N900,000 per month locally, and up to $7,000 USD per month for top remote roles.

AI Research Analyst

In addition, government agencies, think tanks, and NGOs in Abuja hire AI research analysts to apply ML to policy data and programme assessment. Specifically, NITDA, CBN, and the NBS all have data units that use ML tools for economic analysis and fraud detection. This role is a strong fit for graduates with a background in economics, statistics, or social science who add ML skills to their profile.

MLOps Engineer

Furthermore, MLOps is a fast-growing speciality that bridges ML and software engineering. Specifically, MLOps engineers manage the systems that keep ML models running, accurate, and updated in production. Not only is this role in high demand at large Nigerian firms and global tech firms, but it also pays very well. Locally it earns N400,000 to N900,000 per month. Remote roles pay $4,000 to $10,000 USD per month.

Freelance ML Consultant

Finally, freelancing is a strong path for ML-trained Abuja experts. Specifically, platforms like Upwork and Toptal list hundreds of ML freelance jobs each week — covering model building, data labelling, ML auditing, and AI consulting. Moreover, Nigerian ML freelancers with strong portfolios regularly earn $1,500 to $5,000 USD per month working for global clients from Abuja. This path offers both flexibility and strong dollar income.


How to Choose the Right Machine Learning Training in Abuja

With many options available, picking the right ML course comes down to four key factors. So, ask yourself these questions before you sign up:

What Is Your Current Skill Level?

First, be honest about where you are right now. Specifically, if you have no coding background, start with a Python basics course before joining any ML programme. Free Python courses on Codecademy and freeCodeCamp take four to six weeks and cost nothing. However, if you already know Python and basic data analysis, you can jump straight into a full ML course. This way, you will get the most value from your training from day one.

How Much Time Can You Commit?

Next, ML training takes real time and focus. Specifically, a part-time ML course at five hours per week takes three to six months to complete well. A full-time intensive bootcamp can do it in eight to twelve weeks. So, if you work full-time, a live online course with weekend classes is a better fit. Abuja Data School offers this format for working students. Be realistic about your schedule so you do not drop out halfway through.

What Is Your Budget?

In addition, your budget shapes your options but should not stop you from starting. Specifically, the free Google ML Crash Course and the NITDA 3MTT programme are both solid entry points at zero cost. Once you finish these, invest in a paid certificate or bootcamp to go deeper. Furthermore, many Abuja schools offer monthly payment plans. These spread the fee over three to six months, making even premium ML courses manageable on a Nigerian salary.

Do You Have a Career Target in Mind?

Also, knowing your target role shapes which course is best. Specifically, if you want to work at a Nigerian bank or NGO, focus on practical ML and data science skills. If you want remote work with global tech firms, invest in cloud ML platforms like AWS SageMaker or Google Vertex AI. Also build a strong GitHub portfolio to back it up. As a result, your training will be focused and your job search will be far more targeted and fast.


Frequently Asked Questions (FAQs)

Q1: So, Do I Need a Maths Background to Learn Machine Learning in Abuja?

Not necessarily. Specifically, practical ML courses using Python and Scikit-learn require only basic maths — addition, percentages, and a feel for patterns. However, if you want to go deep into neural networks and research-level ML, a stronger stats and linear algebra background will help a lot. In addition, many Abuja schools include a maths refresher module at the start of their ML programme. So, do not let fear of maths stop you from starting — the practical skills come first.

Q2: Furthermore, How Long Does It Take to Get a Machine Learning Job After Training?

That depends on how active you are after your course. Generally, learners who finish a three-to-six month ML programme and build two to three projects are ready to apply. Most land their first ML role within six to twelve months of consistent effort. In addition, joining local tech groups in Abuja — such as the Abuja Tech Hub and Data Science Nigeria community — speeds up the process greatly. So, stay visible and keep building after your course ends.

Q3: Also, Can I Learn Machine Learning Online From Abuja?

Yes, absolutely. In fact, some of the best ML courses in the world are fully online and run well on a standard Nigerian 4G or broadband connection. Specifically, Google Colab lets you train ML models in the cloud for free — so you do not need a powerful laptop. Furthermore, Coursera, edX, and YouTube all host world-class ML content that is fully open from Abuja. So, location is no barrier to learning machine learning in Nigeria today.

Q4: Additionally, What Laptop Do I Need for Machine Learning Training?

For beginner and mid-level ML courses, a standard laptop with 8GB RAM and a Core i5 processor is enough. Specifically, Google Colab runs model training in the cloud, so your local machine does not need a GPU to get started. However, if you plan to train large deep learning models locally, a laptop with 16GB RAM and a dedicated GPU gives much faster results. In addition, many Abuja schools provide lab computers for in-person students so you can train on their machines during class.

Q5: Finally, Is Machine Learning Training Worth the Investment in Abuja in 2025?

Yes — without question. Specifically, ML skills are now among the top three most requested skills in Nigerian tech job listings. Furthermore, ML-trained experts in Abuja earn two to four times more than their peers in standard IT or data entry roles. In addition, the global remote market for ML talent is growing fast — giving Abuja-based ML engineers access to dollar income without leaving Nigeria. So, the return on ML training in 2025 is one of the highest of any skill you can build right now.


Conclusion

Ultimately, machine learning training in Abuja is one of the best career costs you can make in 2025. Whether you choose Abuja Data School, the NITDA 3MTT track, or the Coursera ML course by Andrew Ng, the key is to start now. Stay consistent and the results will come. In addition, Abuja’s job market is ready for ML talent — and the global remote market offers even more. So, there has never been a better time to get started.

Your Next Step Starts Today

To that end, pick one course from this guide that matches your goal, budget, and skill level. Then sign up this week — not next month. Above all, remember that the best ML course is not the most expensive one — it is the one you actually finish and apply. As a result, your first trained model, your first ML certificate, and your first ML job are all closer than you think. Start today and Abuja’s growing tech scene will meet you halfway.

https://www.abujadataschool.com/artificial-intelligence-and-robotics-training-in-abuja-nigeria/

How-to-Become-a-1

Power BI vs Tableau: Which Should You Learn First?

1747452594229

So, which data tool should you learn in 2025, Power BI or Tableau? If so, you are not alone in asking this. Not only is this one of the most common questions in the data world, but it is also one of the most important choices you will make early in your data career. In short, picking the wrong tool can cost you months of wasted study time. So, this guide will help you choose the right one based on your goals, budget, and job market.

Specifically, both Power BI and Tableau are top data tools used by firms around the world. Both turn raw data into clear charts and dashboards. However, they differ in cost, ease of use, job demand, and the types of roles they lead to. Therefore, by the end of this guide, you will know exactly which one to learn first — and why.


So, What Are Power BI and Tableau?

Before comparing the two tools, it helps to know what each one does. This way, you can judge them fairly based on what matters to you.

What Is Power BI?

Simply put, Power BI is a free data tool from Microsoft. It lets you connect to data sources like Excel, SQL, and cloud apps, then build charts and dashboards from that data. In addition, it is part of the Microsoft family, which means it works well with Excel, Teams, and SharePoint. As a result, many firms that already use Microsoft tools adopt Power BI fast and at low cost. Plus, Power BI Desktop is fully free to download and use.

What Is Tableau?

In the same vein, Tableau is a data tool from Salesforce. It is known for its clean drag-and-drop interface and its ability to handle very large datasets with ease. Furthermore, Tableau has been in the market longer than Power BI and built a strong brand in the US, UK, and global tech firms. However, it comes at a cost — Tableau starts at about $75 per user per month, which makes it harder to access for learners and small firms.


Power BI vs Tableau: Head-to-Head Comparison

Now let us compare both tools across the factors that matter most to learners and job seekers. Indeed, this is where the real differences become clear. Here is how they stack up:

Factor Power BI Tableau
Cost Free (Desktop); $10/month for Pro $75/month per user minimum
Ease of Use Easy if you know Excel Very clean drag-and-drop UI
Job Demand (Nigeria) Very high — 80%+ of job ads Low — under 15% of job ads
Job Demand (Global) High — most industries High — tech, finance, US firms
Learning Curve Gentle — Excel skills transfer Moderate — new concepts needed
Data Capacity Good for most business data Excellent for very large data
Mobile Support Strong mobile app available Good mobile app available
AI Features Copilot AI built in (2024+) Einstein AI via Salesforce
Best For Nigerian market, SMEs, govt Global tech, US/UK job market
Certification Cost Free to $165 (PL-300 exam) $250+ for Tableau Desktop cert


So, How Do They Compare on Cost?

Cost is often the first thing that matters — and here, Power BI wins clearly. Specifically, Power BI Desktop is free to download and use with no time limit. You can build full dashboards, connect to data, and share files at zero cost. If you want to publish live dashboards online and share them with a team, Power BI Pro costs about $10 per user per month. That is very fair for most small firms.

Tableau, on the other hand, starts at $75 per user per month for Tableau Creator. While it does offer a free 14-day trial, there is no free tier for ongoing use. As a result, many learners in Nigeria and other developing markets simply cannot afford to practice with Tableau long-term. Furthermore, Tableau’s exam fee starts at $250, compared to Power BI’s PL-300 exam at about $165. So, for budget-conscious learners, Power BI is clearly the smarter choice.

Verdict on Cost

Power BI wins on cost. It is free to start, cheap to scale, and far more accessible for Nigerian learners and small business owners.


Which Tool Is Easier to Learn?

Both tools are easier to learn than coding, but they take different paths to get you there. Therefore, knowing your background helps you pick the right one.

Power BI Ease of Use

If you already use Excel, Power BI will feel natural very fast. Specifically, the data model in Power BI is similar to Excel’s pivot tables, and the interface uses familiar Microsoft design patterns. In addition, DAX formulas — Power BI’s calculation language — are similar in logic to Excel formulas. As a result, most Excel users go from zero to building their first dashboard in a single weekend.

Tableau Ease of Use

Tableau has a cleaner, more visual drag-and-drop interface than Power BI. Indeed, many users say Tableau feels more intuitive when building complex visuals. However, Tableau’s data modelling is different from Excel and takes more time to grasp. Furthermore, Tableau Prep — its data cleaning tool — adds another layer of learning. So, if you have no Excel background, both tools take roughly the same time to learn.

Verdict on Ease of Use

Power BI is easier if you know Excel. Tableau may feel cleaner visually, but its data concepts are less familiar to most Nigerian learners who come from an Excel background.


Power BI vs Tableau: Which Gets You Hired Faster?

Ultimately, the best tool to learn is the one that gets you a job. So, let us look at the real job market data for both tools.

Power BI Jobs in Nigeria

In Nigeria, Power BI dominates the job market. Specifically, over 80% of Nigerian data job listings that mention a BI tool ask for Power BI. Banks like GTBank, Zenith, and Access Bank use it. Telecoms like MTN and Airtel use it. Government agencies and NGOs use it. As a result, learning Power BI gives you the widest possible range of job options in Nigeria. Furthermore, entry-level Power BI roles in Nigeria start at N200,000 to N350,000 per month.

Tableau Jobs in Nigeria

Tableau job listings in Nigeria are far fewer. Indeed, most Tableau roles in Nigeria come from international NGOs or foreign firms with Nigerian offices. While the pay for these roles is often higher — sometimes in dollars — the volume is much lower. Therefore, if your goal is to get hired in Nigeria within the next six months, Power BI is the faster path by a wide margin.

Power BI and Tableau Jobs Globally

However, if you are targeting remote jobs with US or UK firms, both tools are in high demand. Specifically, Tableau is very strong in US tech and finance firms, while Power BI leads in UK and European enterprise roles. In addition, global remote platforms like Andela, Toptal, and Turing list both tools regularly. So, for global remote work, learning both tools eventually makes strong sense.

Verdict on Jobs

Power BI wins for Nigerian job seekers. Tableau has a stronger edge for US-focused remote roles. If your goal is to get hired fast in Nigeria, start with Power BI.


Power BI vs Tableau: Which Pays More?

Pay depends on your market and level of skill. So, here is how salaries compare for both tools in Nigeria and globally:

Role & Tool Entry Level Mid Level Senior Level
Power BI Analyst (Nigeria) N200k–N350k/mo N400k–N650k/mo N700k–N1.1M/mo
Tableau Analyst (Nigeria) N250k–N400k/mo N450k–N700k/mo N750k–N1.2M/mo
Power BI Analyst (Remote/USD) $1,500–$3,000/mo $3,000–$5,500/mo $6,000–$10,000/mo
Tableau Analyst (Remote/USD) $2,000–$3,500/mo $3,500–$6,000/mo $6,500–$11,000/mo


As the table shows, Tableau roles pay slightly more on average — but the gap is small. Furthermore, Power BI roles are far more common in Nigeria, so your chance of landing a role and growing your pay is much higher with Power BI. In addition, once you hold a senior Power BI role, adding Tableau as a second skill takes only a few weeks of extra study.


Certifications: Power BI vs Tableau

Getting certified boosts your profile and pay. So, here is what each tool offers in terms of certs:

Power BI Certifications

The top Power BI cert is the Microsoft PL-300: Power BI Data Analyst Associate. Specifically, this exam costs about $165 and is available at Pearson VUE test centers — including in Abuja and Lagos. In addition, you can prepare for free using Microsoft Learn. As a result, this is one of the most cost-effective data certs available to Nigerian professionals right now.

  • PL-300: Power BI Data Analyst Associate — $165, most sought-after cert in Nigeria
  • DP-900: Azure Data Fundamentals — $95, a good entry-level cert to pair with Power BI
  • PL-900: Microsoft Power Platform Fundamentals — $95, broad intro to the Power Platform


Tableau Certifications

Tableau offers several cert levels, starting with Tableau Desktop Specialist at about $250. Furthermore, the higher-level Tableau Certified Data Analyst exam costs even more. While these certs carry strong weight with global tech firms, the cost is a barrier for many Nigerian learners. However, if you are targeting US or UK remote roles, a Tableau cert can add real value to your profile.

  • Tableau Desktop Specialist, Certified Data Analyst  and Server Certified Associate are about $250, entry-level cert, $300+, mid-level and highly respected globally and  for those managing Tableau at the server level


Verdict on Certifications

Power BI certs win on cost and accessibility for Nigerian learners. Tableau certs carry more weight with global tech firms but cost more and are harder to access in Nigeria.


So, Who Should Learn Power BI — and Who Should Learn Tableau?

Now that you know the key differences, let us be direct. Here is a simple guide based on your specific goals:

Learn Power BI If You Are…

  • A Nigerian professional looking for a job in a local firm, bank, NGO, or government agency
  • A small business owner who wants to track sales and cash flow without spending money on tools
  • An Excel user who wants to level up to proper dashboards and data reports
  • A student or fresh graduate who wants the fastest, cheapest path into data analytics
  • A data analyst who wants to add a Microsoft cert to their CV for Nigerian job applications
  • Someone who works in a Microsoft Office environment — Excel, Teams, SharePoint


Learn Tableau If You Are…

  • Targeting remote jobs with US or European tech companies or consulting firms
  • Already confident with Power BI and want to add a second, globally respected tool
  • Working in a firm that already uses Salesforce — Tableau integrates very well with it
  • A data analyst aiming for roles at global NGOs, UN agencies, or international development firms
  • Willing to invest more money upfront for a tool with a strong global brand


The Smart Career Path

Furthermore, the best move for most Nigerian data professionals is to learn both — but in the right order. First, master Power BI. Get hired, earn a salary, and build real work experience. Then, once you are stable, study Tableau for three to four months on the side. As a result, you become a dual-tool analyst who can serve both the Nigerian market and global remote clients. Consequently, this path gives you the widest possible set of career options.


Free Resources to Learn Power BI and Tableau

In addition to knowing which tool to pick, you need to know where to learn it. Here are the best free resources for both tools:

Free Power BI Resources

  • Microsoft Learn (learn.microsoft.com): Full free Power BI learning path direct from Microsoft — takes about 10 hours to complete
  • Guy in a Cube (YouTube): The best free Power BI YouTube channel — covers DAX, dashboards, and real business use cases
  • com: Free DAX reference and tutorials — the go-to site for mastering Power BI calculations
  • Power BI Community (community.powerbi.com): Free forum to ask questions and get help from Power BI experts
  • org: Covers Excel and Power BI together — great for learners coming from an Excel background


Free Tableau Resources

  • Tableau Public (public.tableau.com): A free Tableau version — limited but enough to practice and build a portfolio
  • Official Training Videos (tableau.com/learn): Free Tableau videos from the makers themselves, covering all skill levels
  • Community Forums (community.tableau.com): Active space with answers to most Tableau questions — great for beginners
  • Coursera — Data Visualization with Tableau: Free to audit — offered by UC Davis, one of the most popular free courses
  • Andy Kriebel (YouTube): One of the top free Tableau YouTube channels — clear, practical tutorials


Frequently Asked Questions (FAQs)

Q1: So, Can I Learn Both Power BI and Tableau at the Same Time?

You can, but it is not a good idea when you are starting out. Learning both at once leads to confusion because the two tools use different data models and workflows. Instead, pick one and get confident with it first. Once you can build dashboards from scratch without help, then add the second tool. Generally, mastering one tool takes three to six months of regular practice.

Q2: Furthermore, Is Power BI Replacing Tableau?

Not replacing — but Power BI is growing faster. Specifically, Microsoft has invested heavily in Power BI since 2016 and it now leads in market share in many sectors. In addition, the addition of Copilot AI to Power BI in 2024 has widened the gap further. However, Tableau still has a loyal base in US tech and finance firms. So, both tools will likely co-exist for many years to come.

Q3: Also, Which Tool Is Better for Data Science?

Neither tool is designed for data science — both are BI and data tools. However, Power BI connects well with Python and R scripts, which data scientists often use. In addition, Tableau also supports Python via TabPy. So, for pure data science work, tools like Python, Jupyter, and SQL matter far more than either Power BI or Tableau. Both are best seen as data reporting and dashboard tools rather than data science platforms.

Q4: Additionally, Do Nigerian Companies Pay More for Tableau Skills?

Slightly more in some cases, but the gap is small and the number of roles is much lower. In fact, a skilled Power BI analyst with a PL-300 cert will earn more over time than a Tableau analyst waiting for the rare Tableau role to open up in Nigeria. Therefore, chase depth in Power BI first — the pay will follow as you grow your skills and experience.

Q5: Finally, How Long Does It Take to Learn Power BI or Tableau?

That depends on your starting point and how much time you put in each week. Generally, most people build basic dashboard skills in four to six weeks at five hours per week. Getting to a job-ready level takes about three months with daily practice. So, the key is consistency — short daily sessions beat long, rare study blocks every time.


Conclusion: Power BI or Tableau — The Final Verdict

Ultimately, for most Nigerian learners and professionals, the answer is clear: start with Power BI. It is free, widely used in Nigeria, easy to learn from an Excel background, and leads to the most job openings in the Nigerian market. In addition, it has strong Microsoft backing, regular updates, and a growing global presence.

Your Action Plan Starts Today

To that end, here is your clear next step. If you are new to data tools, download Power BI Desktop today for free and connect it to one Excel file you already have. Then build your first bar chart. Once you see how fast raw data becomes a clear visual, you will be motivated to keep going. Above all, remember that consistency beats perfection — one hour of practice every day will get you job-ready in Power BI within three months. After that, Tableau is just one more skill to add to an already strong profile.

image-14-scaled

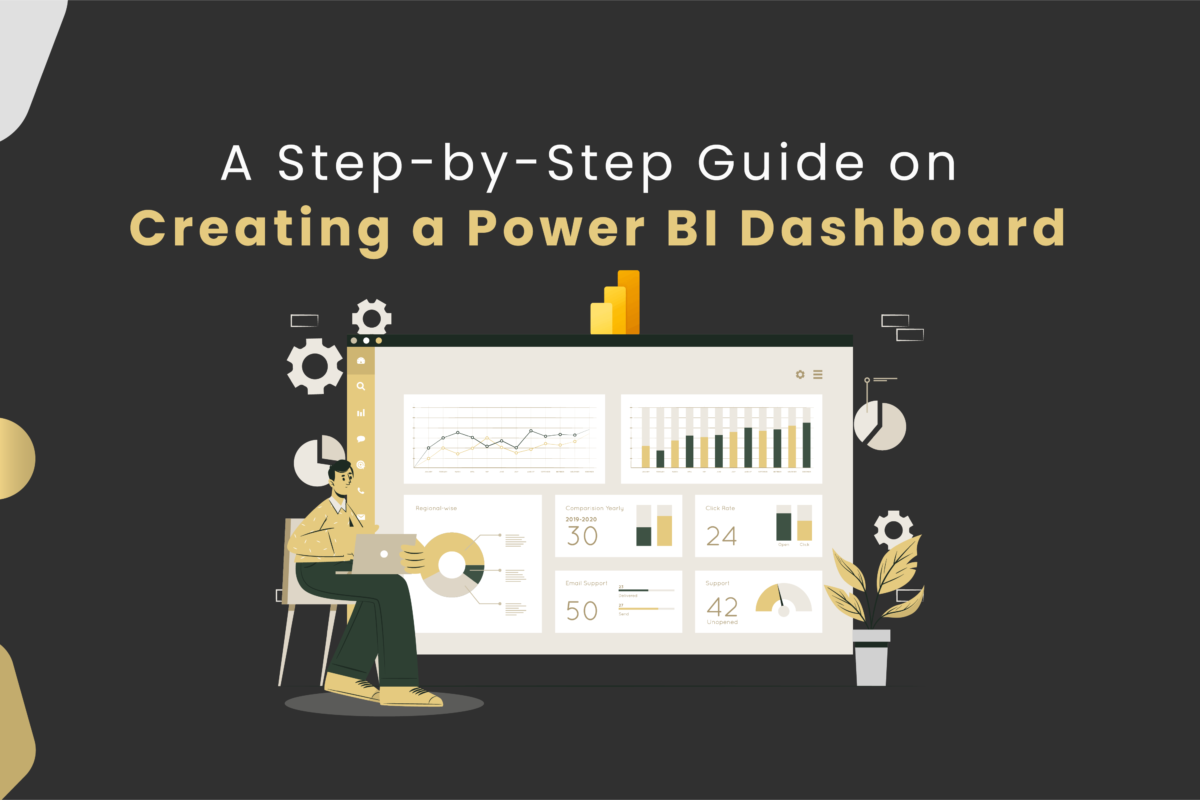
How to Create a Dashboard in Power BI: A Step-by-Step Guide

what-is-microsoft-power-bi-6410345588262008_l

Do you want to create a dashboard in Power BI but are not sure where to start? If so, you are in the right place. Not only is Power BI one of the most in-demand data tools in the world, but it is also free to use and easier to learn than most people think. In short, anyone with basic Excel skills can build a clean, useful Power BI dashboard in just a few hours.

Specifically, this guide walks you through every step — from downloading Power BI to sharing your finished dashboard with your team. Whether you are a student, a business owner, or a data analyst in training, this step-by-step breakdown will get you building fast. Furthermore, the skills you learn here apply to sales dashboards, finance reports, HR trackers, and any other data project you take on.


So, What Exactly Is a Power BI Dashboard?

65cdef0d5bf39730cd742307_ZU7AvePtP3wiH6WL5potaelMwEEPDi65RuRZuDBjmQ5DE6WSA-out-065cdef0d5bf39730cd74230c_8GKaL2oeQA0OOKkGYCzU3b99rjDqJf7Pzt2N9fheAYYhOobJB-out-0

Before diving into the steps, it helps to understand what a Power BI dashboard actually is. Simply put, a dashboard is a single screen that shows your most important data at a glance. It contains charts, cards, tables, and filters that update automatically when your data changes. As a result, you can check your key numbers in seconds without opening a spreadsheet.

However, in Power BI there are two things people call a dashboard — a Report and a Dashboard. Specifically, a Report is where you build visuals on one or more pages using Power BI Desktop. A Dashboard is a pinned collection of visuals from those reports, published in Power BI Service online. In this guide, we cover both. To start, you will build your report in Power BI Desktop, then publish it as a live dashboard online.

Why Build Dashboards in Power BI?

Indeed, Power BI is the tool of choice for dashboard building because of these key reasons:

  • It is free to download and use with no time limit on Power BI Desktop
  • Power bi connects to over 100 data sources including Excel, SQL, Google Sheets, and web pages.
  • The Platform updates your visuals automatically when your underlying data changes.
  • The software runs on desktop, browser, and mobile devices, allowing teams to access dashboards anywhere.
  • The tool is currently the most requested BI platform in Nigerian and African job listings


Step 1: Download and Install Power BI Desktop

First things first — you need to install Power BI Desktop on your Windows PC or laptop. Fortunately, this is completely free and takes only a few minutes. Here is how to do it:

How to Download Power BI Desktop

  • Go to powerbi.microsoft.com on your browser
  • Click the Download Free button on the homepage
  • Choose Power BI Desktop from the options shown
  • Run the installer file and follow the on-screen steps
  • Once installed, open Power BI Desktop and sign in with a free Microsoft account

In addition, you can also download Power BI Desktop from the Microsoft Store on Windows 10 and 11. This method updates the app automatically, which is useful so you always have the latest features. Also, note that Power BI Desktop only runs on Windows. If you use a Mac, you can access Power BI via a browser through Power BI Service instead.


Step 2: Prepare Your Data Before You Import

Next, before you connect your data to Power BI, you need to make sure it is clean and well structured. Specifically, messy data is the number one reason Power BI dashboards look wrong or break. So, take five minutes to fix your data first and save yourself hours of pain later.

Data Cleaning Checklist

Here is what clean data looks like in Power BI:

  • Every column has a clear, short header in row one — such as Date, Product, Sales, Region
  • No merged cells anywhere in the spreadsheet — Power BI cannot read merged cells
  • No blank rows or blank columns in the middle of your data
  • Dates are all in the same format — for example, DD/MM/YYYY throughout
  • Numbers are stored as numbers, not as text — check by aligning cells to the right
  • No totals row at the bottom of the table — Power BI will treat it as a data row

Furthermore, if your data comes from an accounting tool like Sage, QuickBooks, or even a bank statement, export it to Excel first. Then clean it using the checklist above. As a result, your Power BI import will be smooth and your charts will show the right numbers from the start.


Step 3: Import Your Data Into Power BI

Now that your data is clean, it is time to bring it into Power BI. This is called connecting a data source. Specifically, Power BI can connect to many types of data, but for beginners the easiest option is an Excel file. So, here is how to import your first dataset:

How to Import an Excel File

  • Open Power BI Desktop and click Get Data on the Home ribbon
  • Select Excel Workbook from the list of data sources
  • Browse to your Excel file and click Open
  • In the Navigator panel, tick the table or sheet you want to import
  • Click Load to bring the data straight in, or Transform Data to clean it further in Power Query
  • Your data will appear in the Fields panel on the right side of the screen

Using Power Query to Clean Data Inside Power BI

In addition, if your data still needs work after the import, Power Query is your best friend. Specifically, Power Query is a built-in data cleaning tool inside Power BI. To open it, click Transform Data when you load your file. From there, you can remove blank rows, rename columns, change data types, and split columns — all without touching the original Excel file. Moreover, every step you take in Power Query is saved and repeats automatically each time your data refreshes.


Step 4: Build Your First Visuals

This is where the fun begins. Once your data is loaded, you can start building charts. Indeed, Power BI makes this simple — just drag a field from the Fields panel onto the canvas and Power BI picks the best chart type for you. Then you can change the chart type using the Visualizations panel on the right.

The 6 Most Useful Chart Types for Beginners

Not every chart type works for every situation. Therefore, here are the six charts every beginner should master first — along with when to use each one:

Chart Type Best Used For Example Use
Bar Chart Comparing values across groups Sales by product or region
Line Chart Showing trends over time Monthly revenue for the last year
Card Visual Displaying one key number Total sales, total customers today
Pie / Donut Chart Showing parts of a whole Expense breakdown by category
Table Visual Showing detailed row data Top 10 customers by spend
Slicer Filtering the whole dashboard Filter by date, region, or product


How to Add a Chart to Your Report Page

To build your first chart, follow these steps. To start, click on a blank area of the canvas. Then, in the Visualizations panel, click the chart type you want — for example, the bar chart icon. Next, drag a text field such as Product from the Fields panel into the Axis box. After that, drag a number field such as Sales into the Values box. As a result, Power BI will draw your bar chart instantly. You can then resize it by dragging the corners and move it anywhere on the canvas.


Step 5: Format Your Dashboard for a Clean, Pro Look

Building charts is only half the work. Equally important is making them look clean and easy to read. In fact, a well-formatted dashboard gets used far more often than a messy one. So, here are the key formatting steps to take:

Set a Consistent Colour Theme

First, go to View on the top ribbon and select Themes. Power BI has built-in colour themes you can apply in one click. Specifically, choose a theme that matches your brand colours or your company style. Furthermore, using one theme across all charts makes your dashboard look professional rather than patchy.

Add a Title to Every Visual

Next, every chart on your dashboard should have a clear, short title. To add one, click on a chart, then go to the Format panel on the right and turn on Title. Specifically, the title should tell the viewer exactly what the chart shows — for example, Monthly Sales by Region rather than just Sales. This way, anyone who opens the dashboard knows what they are looking at without reading the axes.

Use Card Visuals for Key Numbers

In addition, always put your most important single numbers at the top of the page using Card visuals. For example, a card showing Total Revenue This Month gives the viewer the headline number before they look at any other chart. As a result, the dashboard communicates the most important information in the first two seconds of viewing.

Add Slicers for Easy Filtering

Also, slicers are one of the most powerful features in Power BI. A slicer lets the user filter every chart on the page with a single click. Specifically, add a Date slicer so users can switch between this week, this month, and this year. Then add a Region slicer so sales managers can filter the whole dashboard to their area without any extra work. As a result, one dashboard serves many users with different needs.


Step 6: Set Up Data Relationships for Multi-Table Dashboards

If your data comes from more than one table or Excel sheet, you need to connect those tables using relationships. Specifically, this is how Power BI knows which rows in one table match which rows in another. Furthermore, without correct relationships, your charts will show wrong totals or empty results.

How to Create Relationships in Power BI

  • Click on the Model View icon on the left sidebar — it looks like three connected boxes
  • Power BI will often detect and create relationships automatically when you load related tables
  • To create one manually, drag a field from one table to the matching field in another table
  • A line will appear between the two tables showing the relationship
  • Double-click the line to check the relationship type — most business data uses a Many to One relationship
  • Go back to Report View and your charts will now work across both tables correctly

In addition, the most common relationships in business data are between a Sales table and a Product table joined by a Product ID, or a Sales table and a Date table joined by a date field. So, if your data has ID columns, make sure they match exactly across tables before you build your charts.


Step 7: Add Simple DAX Measures to Power Up Your Dashboard

Once your charts are built, DAX formulas let you create calculated metrics that raw data alone cannot show. Specifically, DAX stands for Data Analysis Expressions and it is Power BI’s built-in formula language. Not only does it look similar to Excel formulas, but it is also far more powerful when working with large datasets.

5 Beginner DAX Measures Every Dashboard Needs

  • Total Sales = SUM(Sales[Revenue]) — adds up all values in the Revenue column
  • Average Order Value = DIVIDE([Total Sales], [Total Orders]) — safe division that avoids errors
  • Sales Growth % = DIVIDE([This Month Sales] – [Last Month Sales], [Last Month Sales]) — month-on-month change
  • Top Product = TOPN(1, Products, [Total Sales]) — returns the best-selling product
  • YTD Sales = TOTALYTD([Total Sales], Dates[Date]) — running total from January to today

Furthermore, to create a DAX measure in Power BI, right-click your table in the Fields panel and choose New Measure. Then type your formula in the formula bar at the top and press Enter. As a result, the new measure appears in your Fields panel and you can drag it into any chart just like a regular column.


Step 8: Publish and Share Your Dashboard Online

Finally, once your report is ready, you can publish it online using Power BI Service so your team can view it in a browser or on their phone. Specifically, this is where your report becomes a live, shareable dashboard. Here is how to publish it:

How to Publish to Power BI Service

  • Click Publish on the Home ribbon in Power BI Desktop
  • Sign in with your Microsoft account if prompted
  • Choose My Workspace as the destination and click Select
  • Wait for the upload to complete — this usually takes under 30 seconds
  • Click the link to open your report in Power BI Service in your browser
  • In Power BI Service, click Pin to Dashboard to create a live dashboard from your report visuals

How to Share Your Dashboard With Your Team

Once your dashboard is live in Power BI Service, sharing it is simple. Specifically, click Share at the top of the dashboard and enter the email addresses of the people you want to share it with. In addition, you can set viewing permissions so some users can only view while others can also edit. Furthermore, anyone you share with can view the live dashboard on the free Power BI mobile app on their phone without needing a desktop installation.

Setting Up Automatic Data Refresh

Also, a key benefit of Power BI Service is automatic data refresh. Specifically, if your Excel file is stored on OneDrive or SharePoint, Power BI can refresh your dashboard data daily or hourly without any manual action. To set this up, go to your dataset in Power BI Service, click the three dots next to it, and choose Schedule Refresh. As a result, your team always sees up-to-date numbers every time they open the dashboard.


Common Mistakes to Avoid When Building Power BI Dashboards

Before you go live with your first dashboard, here are the most common errors that beginners make — and how to avoid each one:

  • Too many visuals on one page: Keep each page to five or six charts maximum. More than that makes the dashboard hard to read. Use separate pages for different topics instead.
  • No clear title or context: Every chart needs a title and every page needs a heading. Without them, viewers cannot understand what they are looking at without asking you.
  • Wrong data types: If a number column is stored as text, your SUM formulas will return zero. Always check that number columns show a sigma symbol in the Fields panel.
  • Missing date table: For time-based charts to work correctly in Power BI, you need a proper date table in your data model. Without one, year-over-year and month-over-month measures will break.
  • Not testing on mobile: Over 60% of dashboard viewers in Nigeria use their phones. Always check your dashboard in the Power BI mobile app before sharing it with your team.
  • Skipping slicers: A dashboard without filters forces you to build separate reports for each user. One slicer can replace ten separate reports. Always add at least a date and region slicer.


Frequently Asked Questions (FAQs)

Q1: So, How Long Does It Take to Build a Power BI Dashboard?

That depends on how clean your data is and how complex the dashboard needs to be. Generally, a basic dashboard with three to five charts and clean Excel data takes two to four hours for a first-time builder. Once you have done it once, your second dashboard will take half the time. So, do not aim for perfection on your first attempt — just focus on getting something working first.

Q2: Furthermore, Can I Build a Power BI Dashboard Without Knowing DAX?

Yes, absolutely. Basic dashboards using bar charts, line charts, and card visuals require no DAX at all. Power BI calculates sums, averages, and counts automatically when you drag number fields into a visual. However, once you want to calculate growth rates, running totals, or year-on-year comparisons, you will need at least a few simple DAX measures. In addition, learning five basic DAX formulas is enough to cover 80% of real business dashboard needs.

Q3: Also, Is Power BI Free to Use?

Power BI Desktop is fully free with no time limit. You can build complete dashboards and export them as PDF or PowerPoint files at zero cost. However, to publish live dashboards online and share them with your team in Power BI Service, you need Power BI Pro at about $10 per user per month. Furthermore, if your organisation uses Microsoft 365, Power BI Pro may already be included in your licence at no extra charge.

Q4: Additionally, Can Power BI Connect to Google Sheets?

Yes, Power BI can connect to Google Sheets via a web connector. Specifically, publish your Google Sheet as a web page using File, Publish to Web in Google Sheets, then copy the CSV link. Next, in Power BI Desktop, click Get Data, choose Web, and paste the link. As a result, Power BI will load your Google Sheet data live and refresh it each time you open the report. This is very useful for teams that store shared data in Google Drive.

Q5: Finally, What Is the Difference Between a Report and a Dashboard in Power BI?

This is one of the most common questions for beginners. Simply put, a Report is built in Power BI Desktop and can have multiple pages with many visuals. A Dashboard is created in Power BI Service by pinning individual visuals from one or more reports onto a single screen. Furthermore, dashboards in Power BI Service are read-only — you cannot edit visuals directly on them. So, always build and edit in the Report first, then pin to a Dashboard for sharing.


Conclusion

Ultimately, creating a dashboard in Power BI is one of the most useful skills you can build in 2025 — whether you are growing a business, climbing the career ladder, or learning data analytics from scratch. In addition, the steps in this guide give you everything you need to go from zero to a published, shareable dashboard in a single day.

Your Next Step Starts Now

To that end, download Power BI Desktop today and open it with one Excel file you already have. Then follow steps one to eight in this guide and build your first chart. Above all, do not wait until your data is perfect or until you know every feature — just start. As a result, you will learn ten times faster by doing than by reading alone. Once your first dashboard is live, the rest of your Power BI journey becomes clear and exciting.

https://www.abujadataschool.com/data-analysis/

Hi, How Can We Help You?