Every business is open to progress. The big question is “How is progress achieved in a business?”. Amongst the numerous activities that go on to keep a business organization going is “the use of data”. The What, How and Why of data to a business organization is the main aim of the Data analytics training in Abuja Nigeria by Abuja Data School where data analytics, data science, business intelligence and visualizations are tutored. Data is powerful. It speaks volume of things done in the past and the progression of outcome by the operations of a business organization. Information obtained from data evaluated can be used as a guide to future expectations.
What is Data Analytics?
Data analytics is the process of analyzing raw data that have been collected to give more insights into a business and further guide in predicting the future from past and present events. Data analytics give more details bringing out the usefulness of data collected. Insights gotten from the data can be used to improve the performance of a business. Introducing tools and techniques to power data analytics such that data collected are presented in ways that makes sense by accuracy, feasibility and coherence makes a business intelligent. More so, business intelligence is a category of tools and strategies established in a business to gather data, scrutinize its functions and present in a more appealing way called data visualization. Business intelligence helps to solve the problem of ‘what’ and ‘how’ of data relevant to a business.
It is important to know that data analytics is a subsection of data science although both technologies use Big Data but from different views. Companies use this big data for industry research. Data science combines practical mathematics, statistics, artificial intelligence and machine learning while data analytics focuses on mathematics and statistical analysis. Data science dives into concepts like data mining, predictive modeling, machine learning and data deduction.
This makes the role of a data scientist different from a data analyst. In relation to business, data analysts are more effective compared to data scientists as after collecting and analyzing data, they draw conclusions by their presentations through visualizations of graphs, line charts and columns. A data analyst is easily understood by both the technical and non-technical arm of an organization. Unlike the data scientist, a data analyst interprets findings in a business-oriented manner.
Why Should You Learn Data Analytics?
The importance of data analytics cannot be over emphasized as it is used to make faster and better business decisions. It is used to predict future sales or purchasing behaviors of customers/clients. It analyzes the effectiveness of marketing and promotional campaigns. This data analytics training in Abuja Nigeria will teach you how to increase supply chain efficiency through these technologies. Do you also want to know how to boost customer acquisition and retention? Abuja Data School has a table set through this data analytics training in Abuja Nigeria.
Roles of a Data Analyst
Wondering what your line of activities would be if you join the data analytics training in Abuja Nigeria?
- Gather new data to answer questions.
- Translate relevant questions into solid analytical tasks.
- Manage and report user feedback using data visualization software like Tableau, Power BI, Qliksense etc.
- Monitor processes and practices to identify occasions for improvement.
Process of data analytics
- Problem statement. This process defines questions, establishes objectives and gives hypotheses. This stage of data analytics requires business metrics, soft skills, lateral thinking and Key Performance Index (KPI) to set objectives straight, identify the type of data needed and where to get them from. Tools helpful in this process include Databox, Dasharoo, Grafana, Freeboard.
- Data collection. This level is where you collect data from sources which could be internal sources (primary data) using Customer Relationship Management (CRM) and emailing tools or external sources (secondary data). Data are in different types which are Quantitative or numeric data e.g. sales figures, monthly reports and Qualitative data e.g. customer reviews/survey. These data are grouped in three different levels namely; First party data (direct relationship with clients ,satisfaction surveys, focus groups or interviews), Second party data (first party data of other organization, website ,app, social media activity) and Third party data (obtained from numerous sources from a third party). Data collection tools include SAAS, Salesforce, Xplenty, Dswarm.
- Data cleansing. It is not uncommon for anomalies and errors to be detected in data. Therefore, this process cleanse data of irregularity, duplicates, missing data and major errors. It is in this stage that unwanted data are removed, typos are fixed, gaps filled and data are restructured. Oftentimes, data cleaning done manually is appreciated. Nevertheless, the tools for cleaning includes Openrefine, Python libraries like Pandas,R packages and Enterprise tools like Data ladder.
- Data analytics. This process analyzes data using techniques like univariate or bivariate analysis regression, cluster, time series. Analysis depends on your goal and set objectives according to the first stage of the problem statement. Categories of analysis include; descriptive analysis (examining what has already occurred), diagnostic analysis (evaluating why an event is happening), predictive analysis (projecting trend of historical data to forecast future growth) and prescriptive analysis (analysis to make recommendations for future).
- Data presentation. At this stage, results and insights regarding the data process are shared. This is where present findings give reports on discoveries and limitations encountered in the process of analysis. Reports should be unambiguous and clear. Reports, dashboards and interactive visualization are used to interpret results. Note that your interpretation will determine decisions that will be taken on the business which is why the data analytics training in Abuja Nigeria will groom you in excellent communication skills. Get to learn the tool for interpreting data such as Google charts, Tableau, Datawrapper, Infogram at Abuja Data School. Also, the Coding tools for interpretation includes Plotty, Seaborn, Matplotlib.
What Skills Do You Need?
- Mathematical and statistical skills.
- Programming skills like SQL, Python and Java.
- Problem solving skills.
- Good communication skills.
TOOLS FOR DATA ANALYTICS
Data analytics will be much more efficient and effective with these tools. Each tool fall under significant categories:
- Spreadsheet tools e.g. Ms Excel, Google spreadsheet. These are good for inputting and viewing data.
- Databases e.g. relational databases such as Ms Access, SQL server, Oracle built for transactions and storage while column, document and graphs for views. Databases do not really analyze data excellently.
- Data visualizations tools e.g. Tableau, Power BI, Qliksense, AWS Quicksight. This is designed for people to use without learning coding.
- Programming languages e.g. R, Python. This is necessary especially finding a path in data science.
- Big data tools e.g Hadoop, Data lakes, Spark. Usually, Big data is too big to be stored on a computer which requires it to be shared among various computers.
- Cloud tools e.g. AWS, Microsoft Azure, Google cloud platform.
Hence, we would look at the tools that will be covered at the data analytics training in Abuja Nigeria by Abuja Data School.
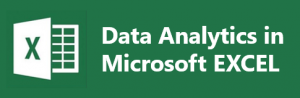
MICROSOFT EXCEL
Microsoft Excel is a spreadsheet software developed by Microsoft. It is compatible with Windows, iOS, Android and macOS.
Pros:
- It can organize a large amount of data into charts, line graphs and histograms.
- It can be added easily to other Microsoft office software to create more visualizations.
- It programs with Visual Basic Applications which can automate and customize functions.
Cons:
- It is more of a spreadsheet therefore cannot help to make instant decisions.
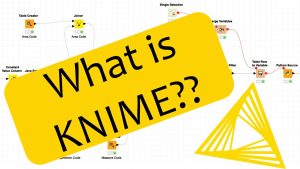
KNIME
KNIME (Konstanz Information Miner) is a free and open source data analytics for integration and reporting of data. It supports the Windows, Linux and OS X operating systems.
Pros:
- It is an open source platform for data analytics and integration.
- It has an interactive user interface with drag and drop feature.
- It supports team collaboration.
- It has a quality visual workflow and can handle large amounts of data.
- It is great in fast problem solving and features multi-threaded in-memory data processing support.
Cons:
- It consumes memory in large capacity.
- It is slow in speed.
SAS
SAS (Statistical Analysis System) is a statistical software for data analytics developed by the SAS Institute. It is compatible on Windows, IBM mainframe, OpenVMS Alpha and Unix/Linux.
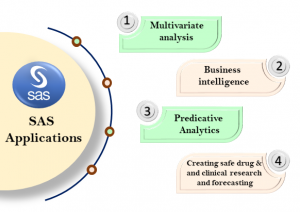
Pros:
- It integrates easily with MS office tools.
- Better analysis is done using automatic code generation and SAS SQL.
- Interactive dashboards can be created for easy understanding of compound data.
- It has a proficient data management system.
- It is easy to debug.
Cons:
- It is not open source and therefore cannot be utilized generally.
- Mining data text is hard.
- Slow in speed.
R ANALYTICS
R Analytics is an open source programming language used mostly by academicians for research, statistical analysis and data mining
Pros:
- It is easy and does not need a license.
- It can handle large datasets.
- It has incredible data visualization and graphic abilities.
- It is compatible with any operating system.
- It is open source and programmable with many features.
Cons:
- Implementation of more programming languages, i.e. It requires programming skills.
- Large memory consumption and slow speed.
- It is not easy to learn.
- It is prone to error because of the language.
PYTHON
Python is an object oriented programming language. It is a general-purpose language used to create websites, data science, task automation, data analysis and visualization.
Pros:
- It can handle data excellently.
- It is easy to learn and handle.
- It is flexible and can be used for multiple functions.
Cons:
- High memory consumption.
- Speed limitations.
SPSS
SPSS (Statistical Package for the Social Sciences) is a powerful tool used to manage data and analyze complex data from any source. It is developed by SPSS Inc., acquired by IBM in 2009.
Pros:
- It is quick and easy to learn.
- It has an interactive interface.
- It can handle any amount of data.
- It can import any data file format like csv, html, pdf etc.
- It looks like Microsoft Excel but can handle large data sets.
Cons:
- It cannot handle very large data in a set.
- It is expensive.
- It has functions limited to what is in-built.
STATA
Stata is a friendly tool used mostly by social sciences capable of analyzing data to visualizing data. It is a statistical package developed by StataCorp for data handling, automation in reporting and visualization.

Pros:
- It provides version control.
- It is easy to use.
Cons:
- Its functions are limited to numeric data, and cannot analyze scripted data.
- It is limited to the functions embedded in it and particular data types.
EPI
EPI is a tool for data structuring and works with quantitative data. It was developed in 2007 by JM Lauritsen. It is only compatible with Windows operating systems having cross-platform versions under construction.
Pros:
- It is free for all users.
- It is easy to select subsets of data for analysis without deleting relevant data.
- It constantly saves analysis steps performed.
- It automatically includes all data points viable in calculations/tests.
Cons:
- It is compatible with Windows operating systems only.
- It is quite difficult to learn.
- Its analytic options are limited to basic methods.
- Its graphics are appalling.
MATLAB
MATLAB (MATrix LABoratory) is a computing environment with multiple programming functions used to manipulate and implement data. It was developed in the late 1970s by MathWorks. It is compatible with different operating systems. It is mostly used by engineers and scientists.

Pros:
- It can easily perform computation.
- It is easy to test algorithms.
- It supports external libraries.
Cons:
- It is an interpreted language, not a compiler and takes time to execute.
- It is expensive.
- It requires a large memory space.
DHIS2
DHIS2 (District Health Information Software 2) is an open source analytical platform that evaluates, reports and dispenses data for health schemes. It was developed by the Health Information Software Programme using Java programming language. It is mostly used by the health industry.

Pros:
- It allows for easy importation of data from both technical and non-technical users.
- It allows users to send data from place to place without the internet.
- It is open-source and can be contributed to.
Cons:
- The system of analysis is manual.
EVIEWS
EViews is a software package for data analytics and statistical functions using time series for evaluation developed by Quantitative Micro Software firstly in 1994.
Pros:
- It is excellent in managing data quickly and efficiently.
- It is very good for generating forecasts.
- It presents high quality graphs, columns and tables.
Cons:
- It runs on only Windows.
- It is not easy for non-programmers.
SQL
SQL (Structured Query Language) is a programming language that is used to manage data stored in relational databases as explained earlier developed by ISO/IEC in 1974. It is a cross-platform software that runs on any operating system.
Pros:
- It is known for its high processing speed.
- It fetches a large amount of data quickly.
- It does not necessarily require professional coding skills.
Cons:
- It is expensive.
KOBO TOOLBOX
Kobo Toolbox is a statistical package that is free and open source. It is used mainly in the humanitarian industry and development sector to collect and manage data.

Pros:
- It is an open source data collector used on mobile devices.
- It is free to use.
- It can be used offline.
Cons:
- It is prone to errors
- It is a low-level control software which uses firmware.
Careers In Data Analytics
Data analytics skills are in-demand as most and many businesses seek to up their game. Looking at the benefits of data analytics to the performance of a business, developing a career in this field seems promising. Hence, the unlimited opportunities to position oneself through this data analytics training in Abuja Nigeria by Abuja Data School;
- Data analyst.
- Data scientist.
- Business intelligence expert.
- Data engineers/analytics expert.
- And many more.